T&C LAB-AI
Robotics
Expectation Maximization and
Gaussian Mixture Model
Lecture 12
Jeong-Yean Yang
2020/12/10
1
T&C LAB-AI
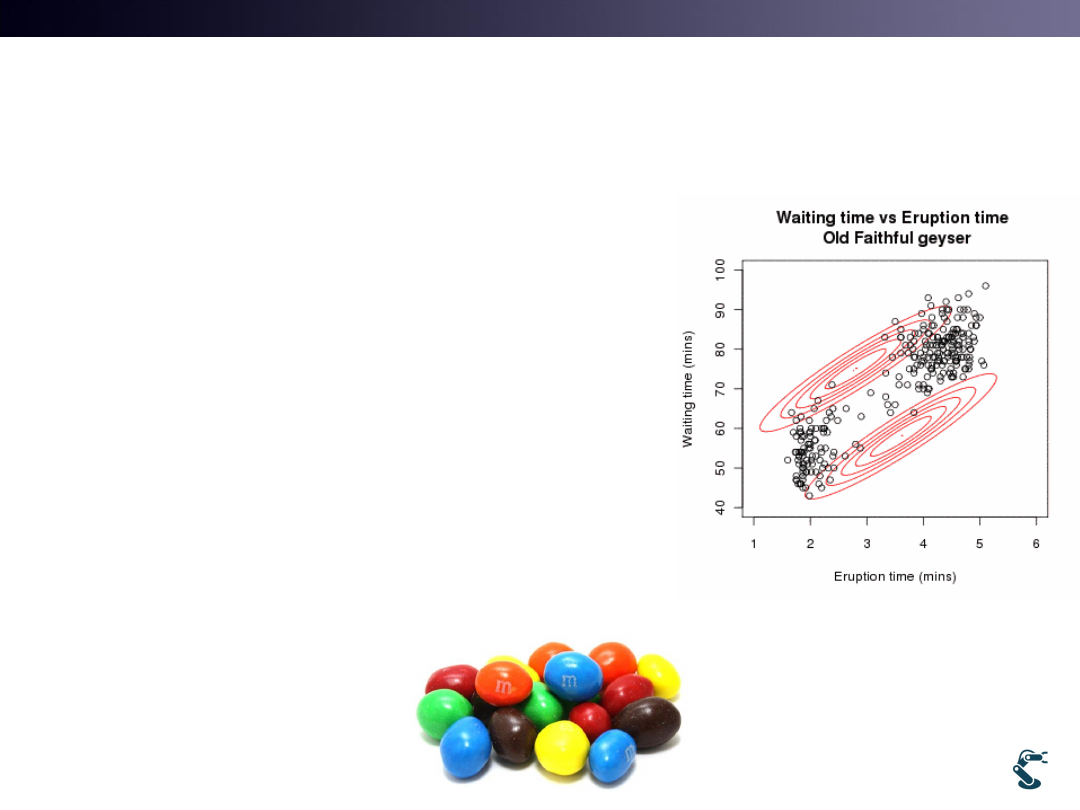
Multi Dimensional
Probabilistic Distribution
1
2
T&C LAB-AI
Robotics
Gaussian Distribution
3
2
1
1
Pr( )
( )
,
( )
exp
2
2
x
x
x
p x dx PDF
p x
T&C LAB-AI
Robotics
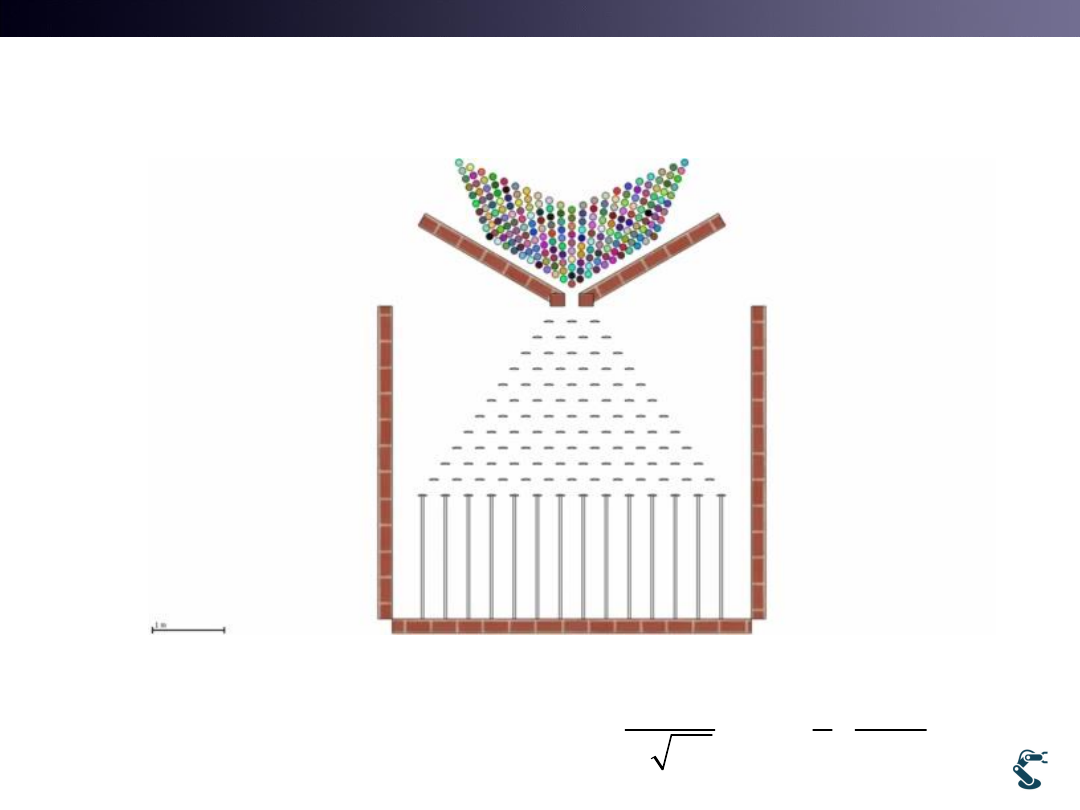
With C++ or Python,
How to Generate Gaussian Distribution?
• Rand() returns integer from 0 to RAND_MAX(32767)
– Rand() is NOT Gaussian(Normal) distribution
• Remind the video
4
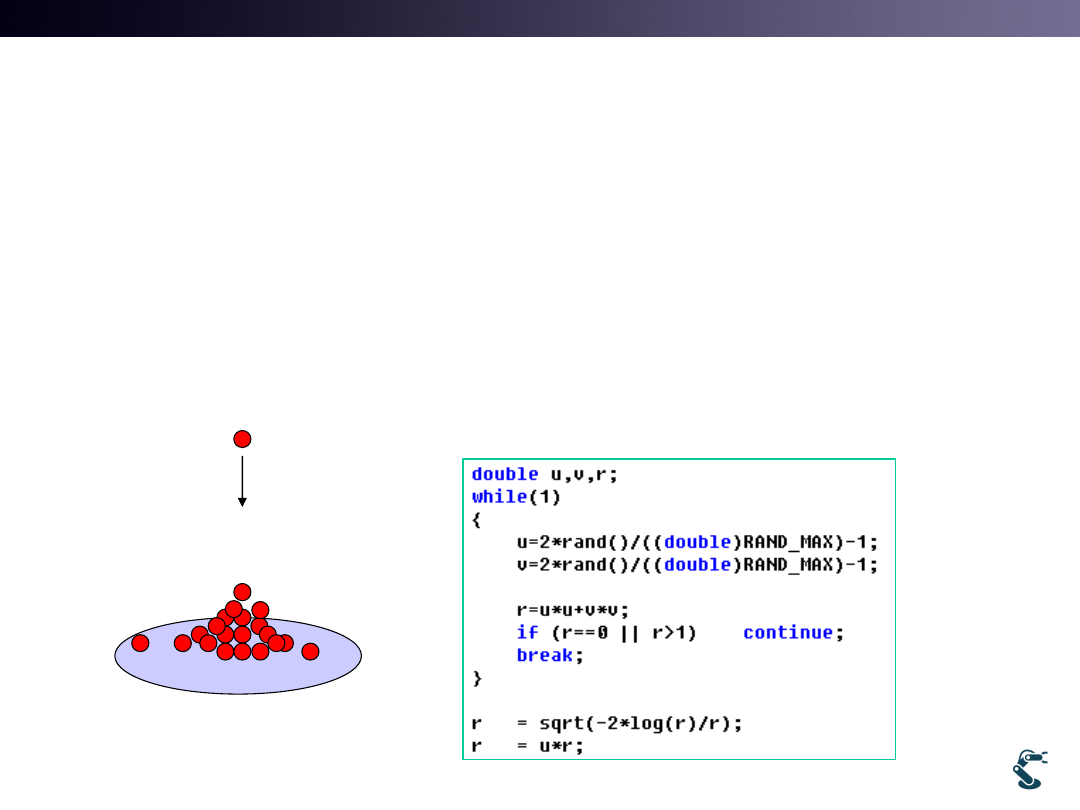
*Marsaglia polar method
~
(0,1)
r
N
T&C LAB-AI
Robotics
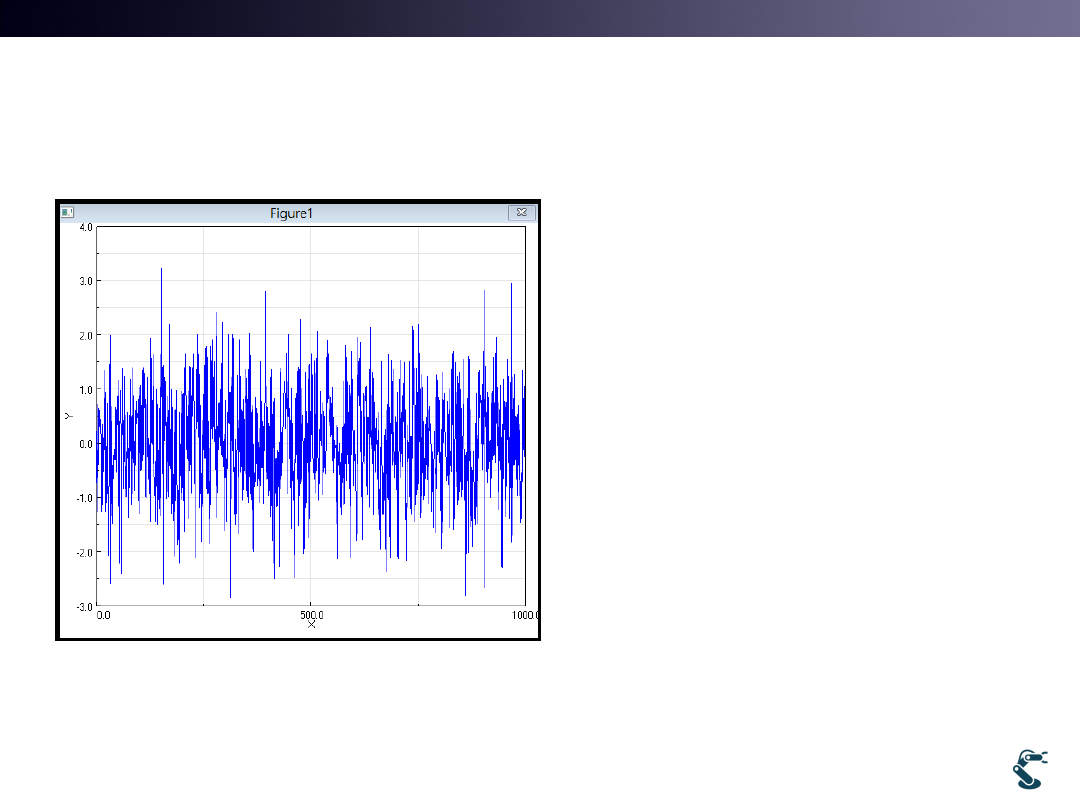
N(0,1) returns Gaussian Distribution
randn(1,1000) generates
1000 samples
Question:
How we generate x with
mean and standard
deviation?
5
1000 samples
2
~
(0,1)
' ~
( ,
)?
x
N
x
N
T&C LAB-AI
Robotics
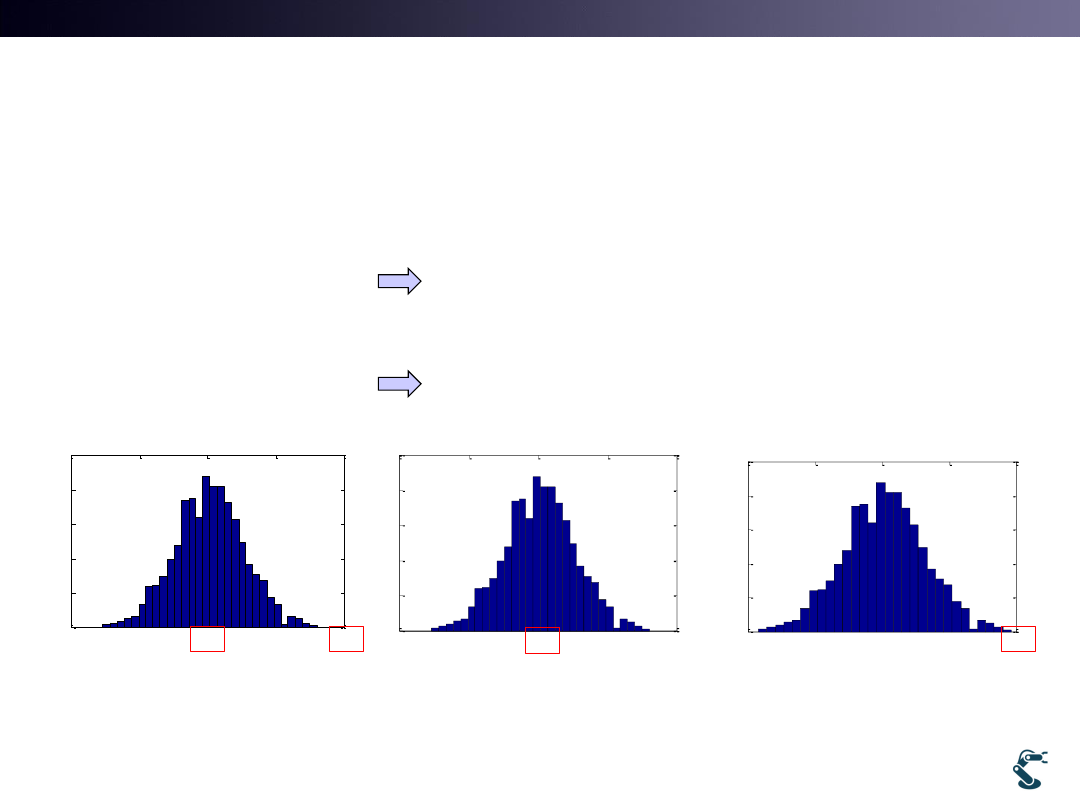
Gaussian Generation
• Mean value: is a offset from 0
• Standard deviation
6
2
' ~
( ,
)
x
N
~
(0,1)
x
N
' ~
(0,1)
( ,1)
x
N
N
~
(0,1)
x
N
'
4
' ~
(0,1) 4
(4,1)
x
x
x
N
N
~
(0,1)
x
N
2
' ~
(0,1)
(0,
)
x
N
N
-4
-2
0
2
4
0
20
40
60
80
100
0
2
4
6
8
0
20
40
60
80
100
-10
-5
0
5
10
0
20
40
60
80
100
2
' 3
' ~ 3 (0,1)
(0,3 )
x
x
x
N
N
T&C LAB-AI
Robotics
Gaussian Distribution or
Normal Distribution(Z)
• We learn it at high school, TT.
• Z is called “Normal Distribution”
• X is normalized with mean and standard deviation
7
z ~
(0,1)
N
2
z
~
(0,1)
~
(0,1)
( ,
)
x
N
x
N
N
2
1
1
( )
exp
2
2
x
p x
2
1
1
PDF(z)
exp
2
2
z
T&C LAB-AI
Robotics
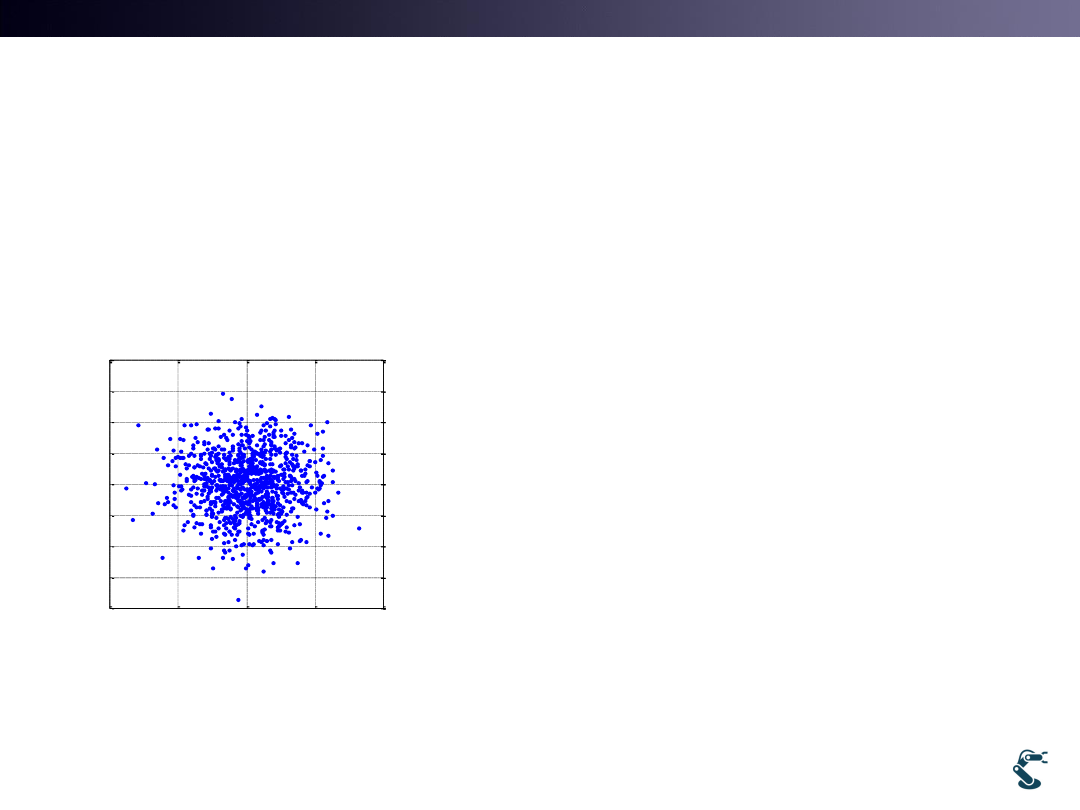
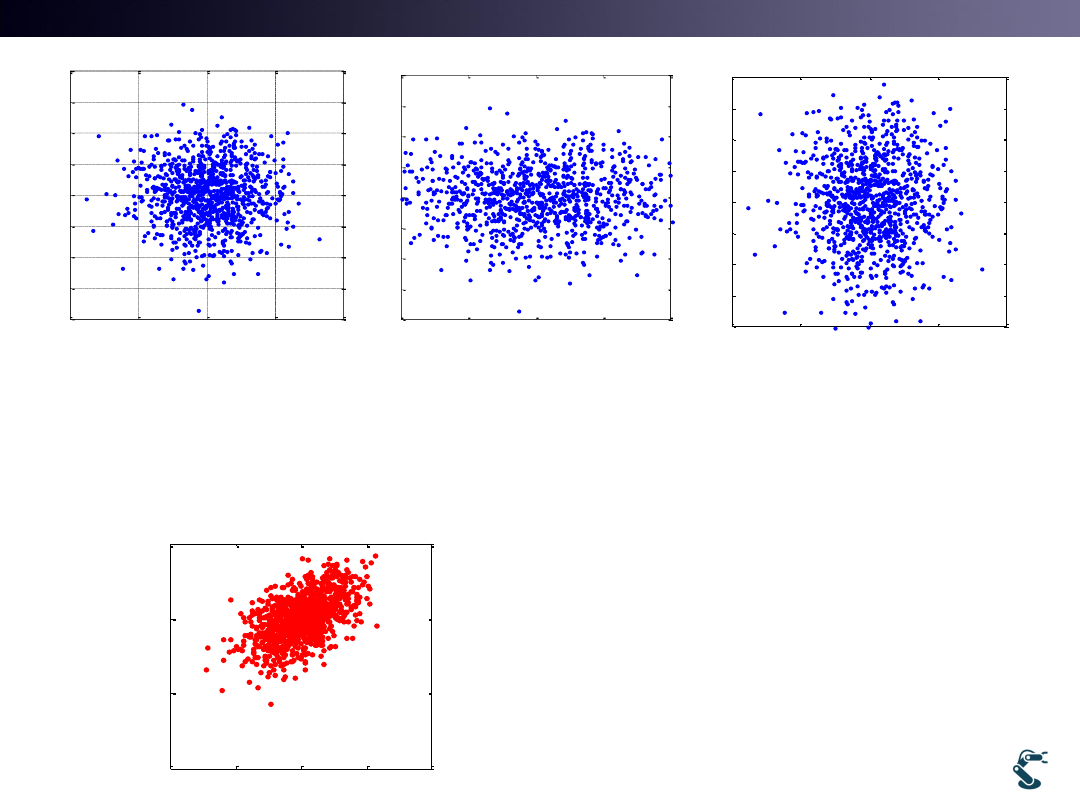
Probability in 2D Space
• How to generate 2D Gaussian Distribution?
– Easy. A= randn(1000,2) and plot(A(:,1),A(:,2),’.’)
8
-4
-2
0
2
4
-4
-3
-2
-1
0
1
2
3
4
Plot( A(:,1),A(:,2),’.’)
1
z ~
(0,1)
N
2
2
0
z
~
,
0
x
N
y
1 DIM
2 DIM
mean
mean
x
y
?
T&C LAB-AI
Robotics
9
-4
-2
0
2
4
-4
-3
-2
-1
0
1
2
3
4
Plot( A(:,1),A(:,2),’.’)
-4
-2
0
2
4
-4
-3
-2
-1
0
1
2
3
4
Plot( 2*A(:,1),A(:,2),’.’)
-4
-2
0
2
4
-4
-3
-2
-1
0
1
2
3
4
Plot(A(:,1), 1.5*A(:,2),’.’)
2
z
x
y
2
2
z'
x
y
2
z'
1.5
x
y
-10
-5
0
5
10
-10
-5
0
5
How we make it?
2
0.5
'
0.5 1.5
x
z
y
x
y
T&C LAB-AI
Robotics
Quiz 1
10
2
3
'
3 1.5
x
z
y
How it will distribute?
2
3
Hint :
3 3 0
3 1.5
Det
-10
-5
0
5
10
-10
-5
0
5
10
-4
-2
0
2
4
-4
-3
-2
-1
0
1
2
3
4
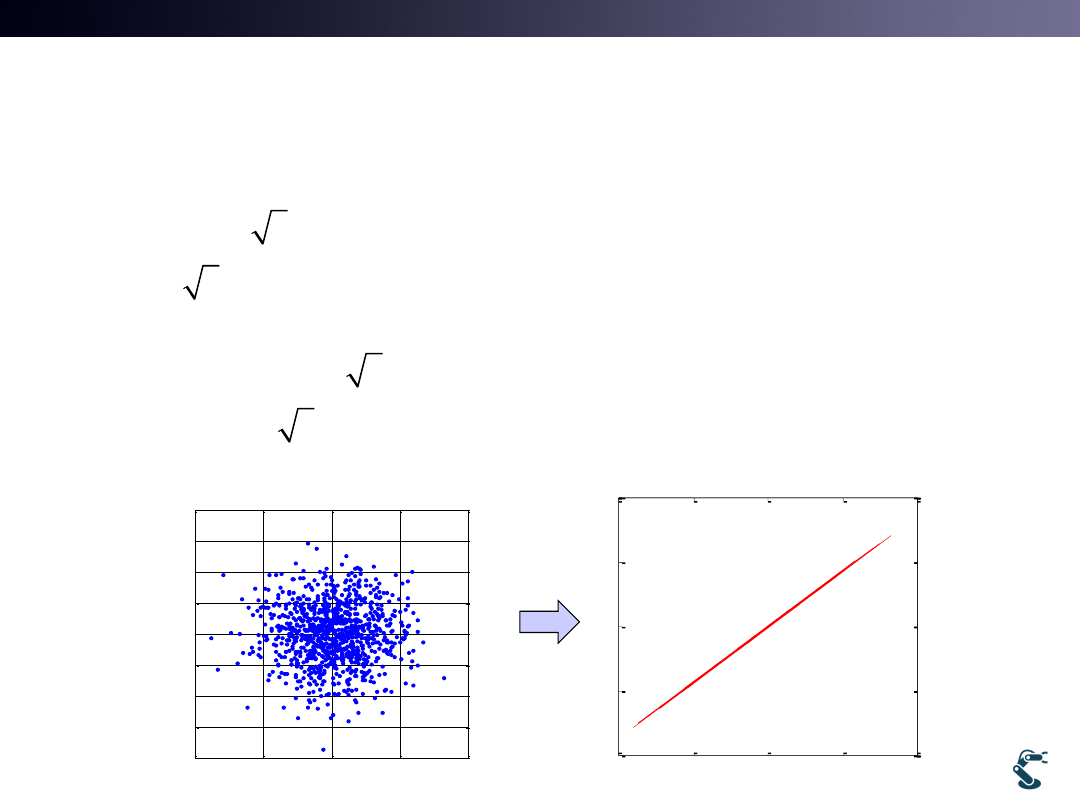
T&C LAB-AI
Robotics
Quiz 2
Why PDF is Over One?
• What is PDF?
• PDF is not a Probability. p(0) may be over 1.
• Gaussian function is NOT a Probabilistic function
But is a Probabilistic Density Function
11
2
1
1
Pr( )
( )
, PDF= ( )
exp
2
2
x
x
x
p x dx
p x
2
0.1
0
1
1
( )
(0)
exp
0
3.99
2
0.1 2
p x
p
T&C LAB-AI
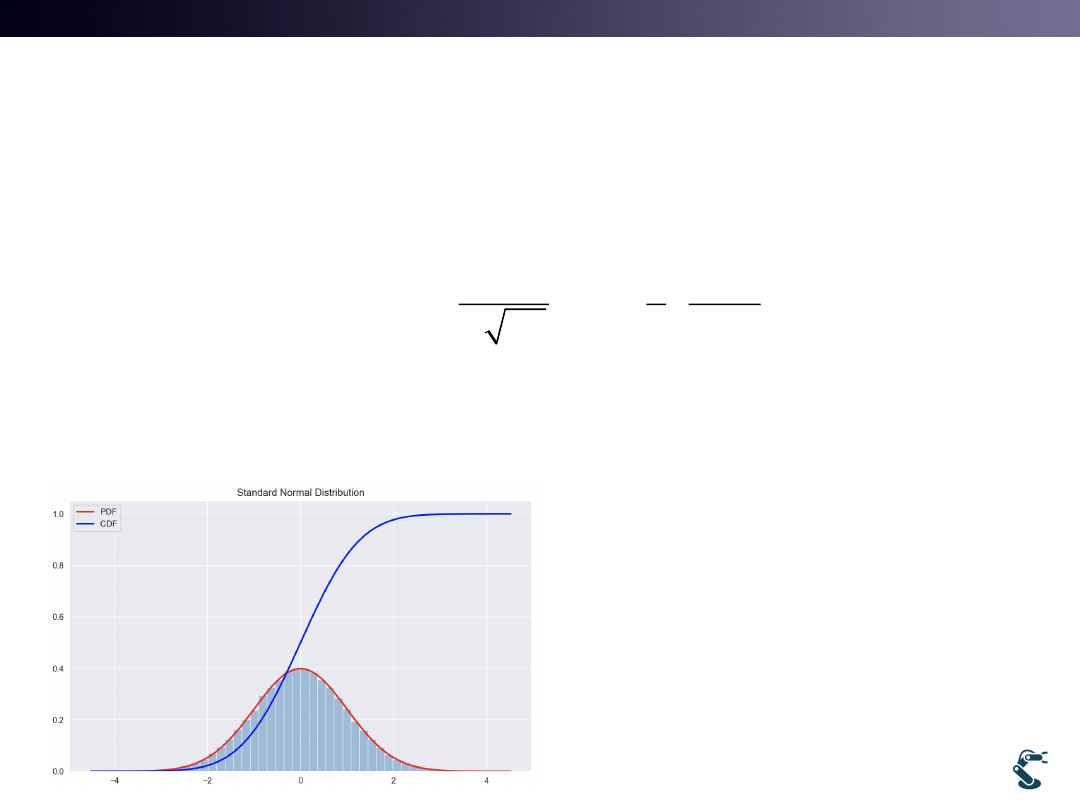
Robotics
Cumulative Distribution Function(CDF)
is the integration of PDF
• Think Probability Exactly
12
2
1
1
PDF= g( )
exp
2
2
( )
Pr( )
Prob( )
x
x
x
CDF
g x dx
x
x
g( )
1
x dx
• d(CDF)/dx = PDF
• p(x) in PDF is NOT a
probability
T&C LAB-AI
Robotics
Probabilistic Density Function
in n-dim. Space
• 1Dim
• N-Dim
• Look, Sigma matrix
13
2
1
1
Pr( )
g( )
, PDF= g( )
exp
2
2
x
x
x
x dx
x
2
~
( ,
)
x
N
ˆ
ˆ
~
( , )
x
N
1
1
2
1
ˆ
g( )
(2 )
( )
exp
2
T
N
x
Det
x
x
2
0.5
0.5 1.5
2
0
0 1.5
Scale factor for
principal axis
...
0.5
0.5
...
Rotation
Important for
Map
matching

T&C LAB-AI
Robotics
Two types of Probability
• A Priori Probability
– When you use probability, you use a prior probability
• Posterior Probability (Conditional probability)
– Bayesian probability
– Prob. Of A on condition that B occurs,
• A prior and Posterior probability are very different.
14
Pr(A)
0.6
Pr(A | B)
0.6
T&C LAB-AI
Robotics
Conditional Probability
• What is Pr(A|B)?
– Probability of A under the Probability of B
– Or Probability of A within the given B
15
A
B
A^B
B
= Pr(A|B)

T&C LAB-AI
Robotics
Posterior Prob.
• When events A and B occur,
• P(A): Probability of A occurrence
• P(B): Probability of B occurrence.
• P(A^B): Probability of Both A and B occurrence
• Definition:
16
( | ) ( )
( ^ )
( | ) ( )
( | ) ( )
P( | )
( )
P A B P B
P A B
P B A P A
P B A P A
A B
P B
(A^ B)
P( | )
( )
P
A B
P B

T&C LAB-AI
Robotics
Engineering Notation
17
(x | w) (w)
P(w | x)
(x)
P
P
P
likelihood
prior
Posterior
Evidence
In engineering, likelihood is one of the popular solution.
T&C LAB-AI
Robotics
Prob. Of Event X between w1 and w2
• p(x)= Probability of event x’s occurrence
• Posterior probability must be required for Classification
18
w1
w2
1
2
Prior Prob. : (
), (
)
p w
p w
x
( )
?
p x
1
2
1
1
2
2
( )
( ,
)
( ,
)
( |
) (
)
( |
) (
)
p x
p x w
p x w
p x w p w
p x w p w
1
1
1
1
1
( |
) (
)
( |
) (
)
(
| )
( )
( | w ) ( )
i
i
i
i
p x w p w
p x w p w
p w x
p x
p x
p w
T&C LAB-AI
Concept of Clustering
2
19
T&C LAB-AI
Robotics
What is a Clustering?
• Grouping similar objects and labeling a Group
– Labeling a Class
• Grouping a set of Objects which are more similar to
each other than to those in other groups
20
T&C LAB-AI
Robotics
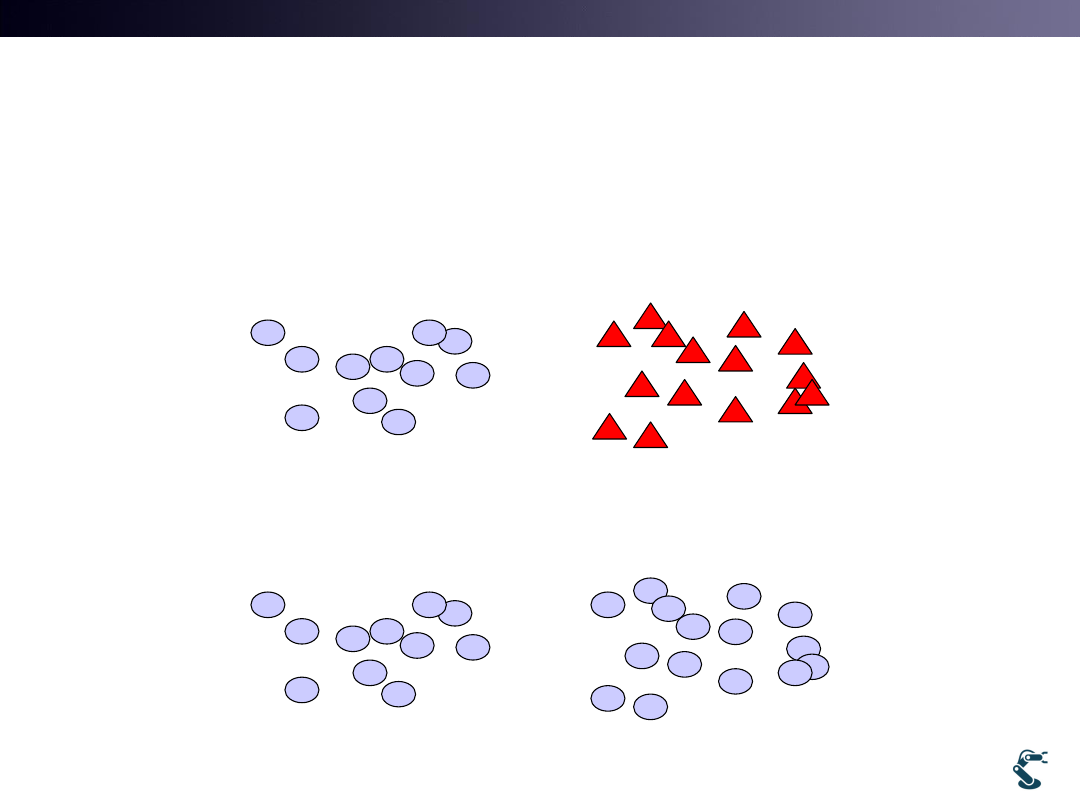
Clustering Method
Important Tools for Intelligent Robotics
• Pattern recognition requires Class definition
• How many classes here?
• There are only two lumps Two clusters.
21
2 classes

T&C LAB-AI
Robotics
Famous Clustering method
• 1. K-Means Clustering method
– Geometry based method
– Simple and low computational burdens.
– Shortcoming: Initial guess determines the final result
• 2. Expectation Maximization method
– Probabilistic method
– Very popular for fitting Mixture Distribution
– Back bone of Gaussian Mixture Model (GMM)
22
T&C LAB-AI
Robotics
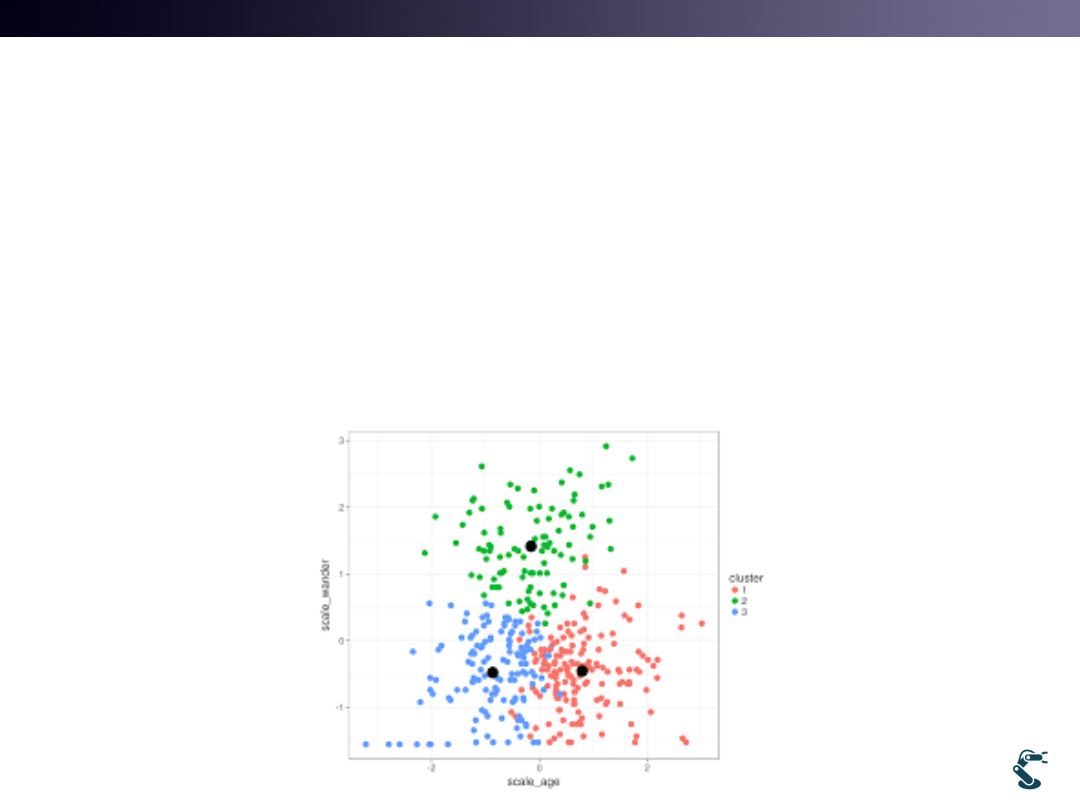
K-Means Clustering
• Find Mean value (Centroid) for each cluster
• Algorithm
• 1. Assume there are K clusters.
• 2. Guess each centroid of cluster.
• 3. Find k points to closest centroid
• 4. Recompute the centroid of each cluster.
23
Centroid
Data
T&C LAB-AI
Robotics
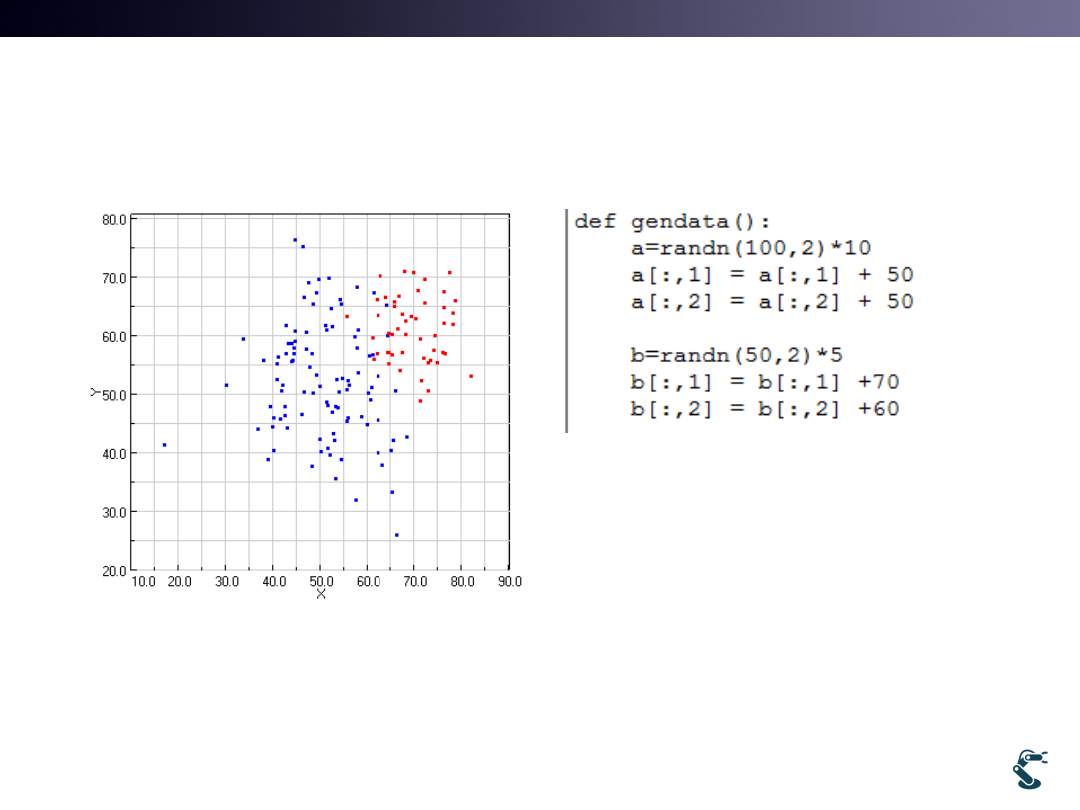
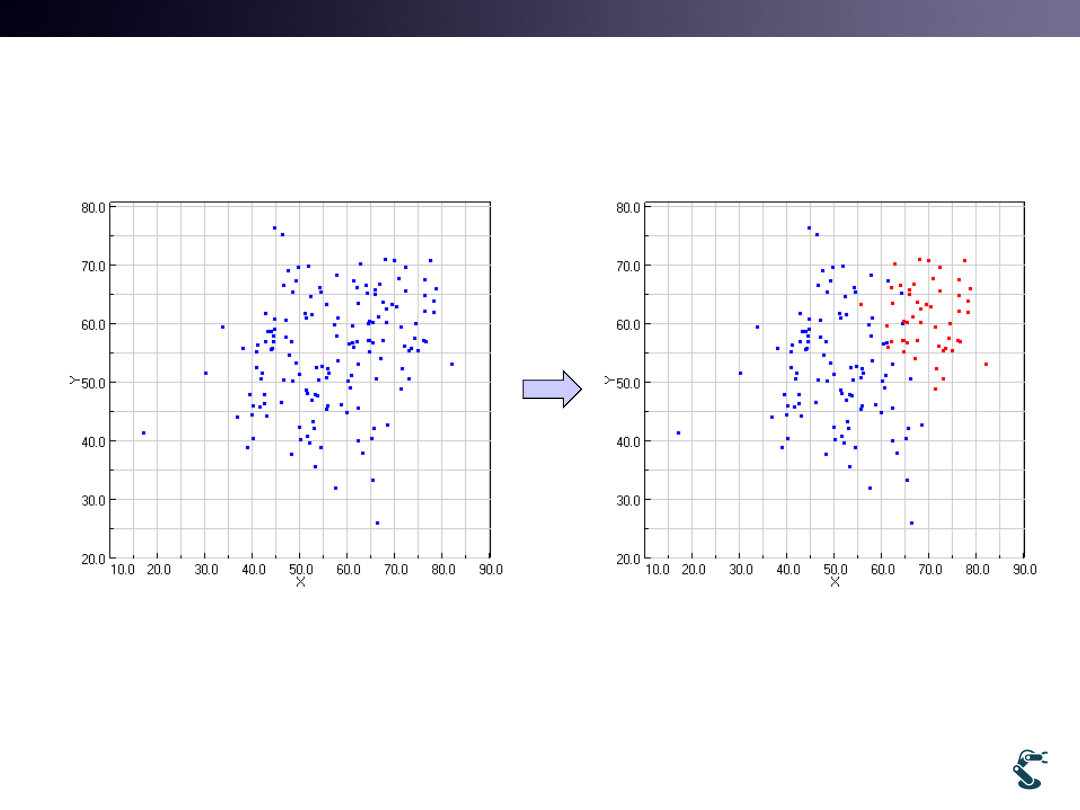
ex/ml/l12kmean.py
• Two groups with Blue and Red
• It looks easy to find two groups
24
2
2
2
2
2
2
10
0
Blue ~
( ,
)
([50,50],
)
0
10
5
0
Red ~
( ,
)
([70, 60],
)
0
5
N
N
N
N
T&C LAB-AI
Robotics
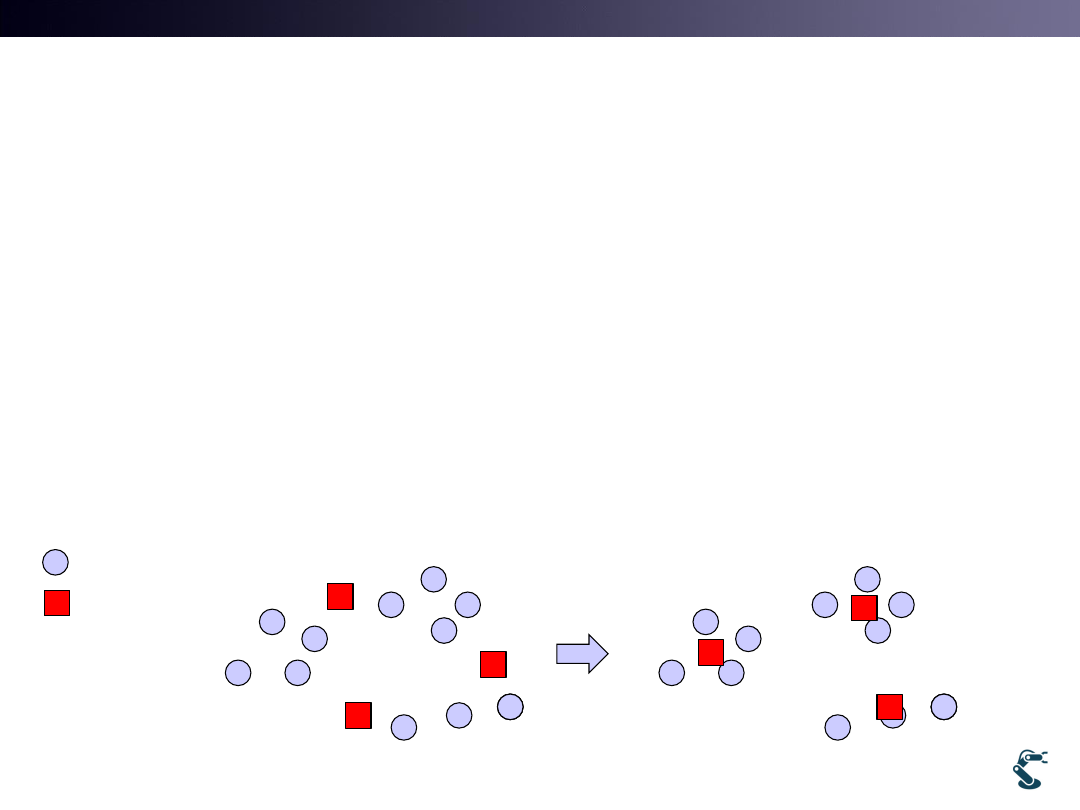
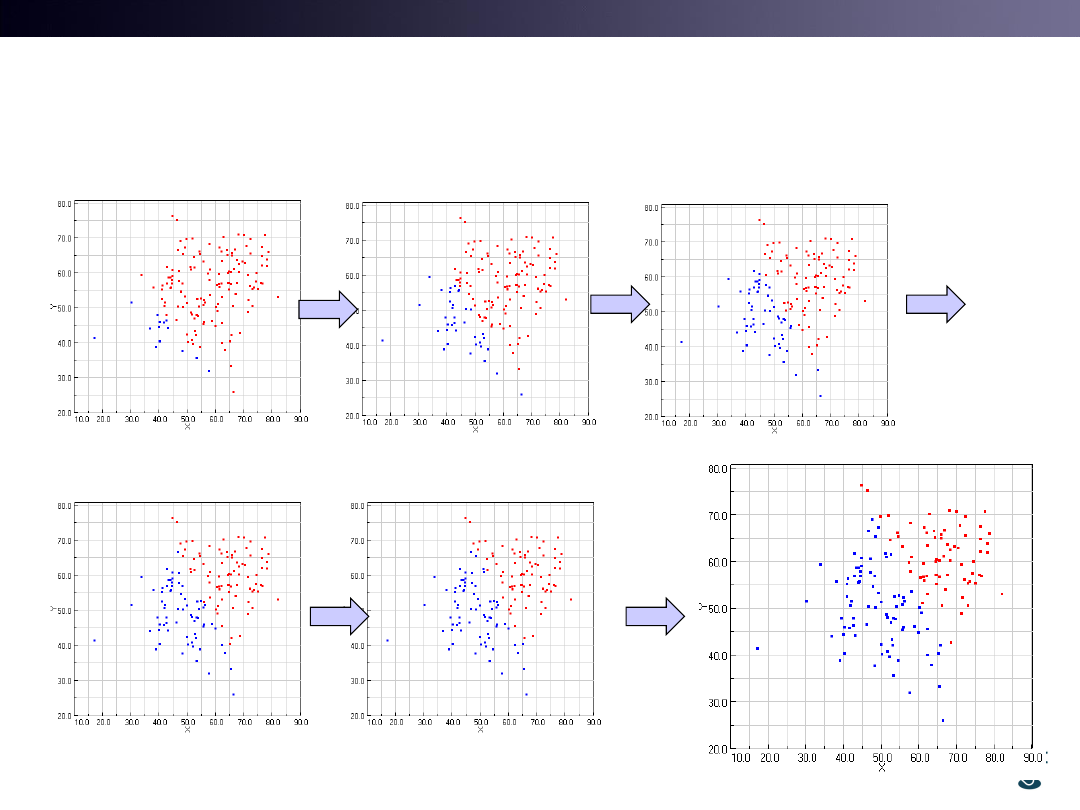
Real Problem is to find Two Groups
• It is NOT easy.
• By iteration, we find two groups from initial guesses.
25
T&C LAB-AI
Robotics
26
1
1
2
2
l12 kmean.test(
,
,
,
,
)
x
y
x
y iteration
T&C LAB-AI
Robotics
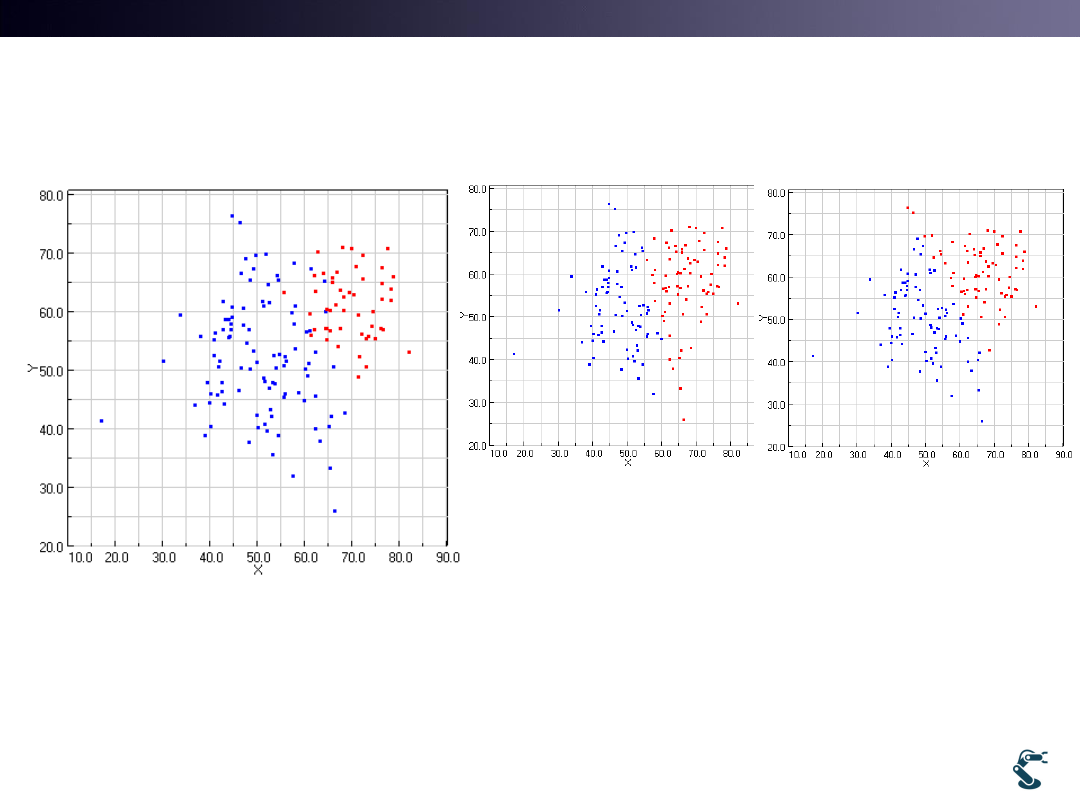
l2kmean.test with Different Guesses
• The Results are strongly affected by Initial Guesses
27
True value
(40,50) and (80,50)
(20,30) and (80,80)

T&C LAB-AI
Robotics
Centroid of Cluster
What is it?
• In k means cluster,
– Centroid approaches mean value of the test distribution.
– But, it is not on the Exact mean value.
– Why?
• Think the role of K mean cluster.
– K closest points are Not whole data. Just Sample.
In each turn, K mean clustering method find the centroid
of K closest points.
– If Initial centroid is biased, centroid is sometimes biased.
• If we guess wrong number of centroid, how it works?
28
T&C LAB-AI
Robotics
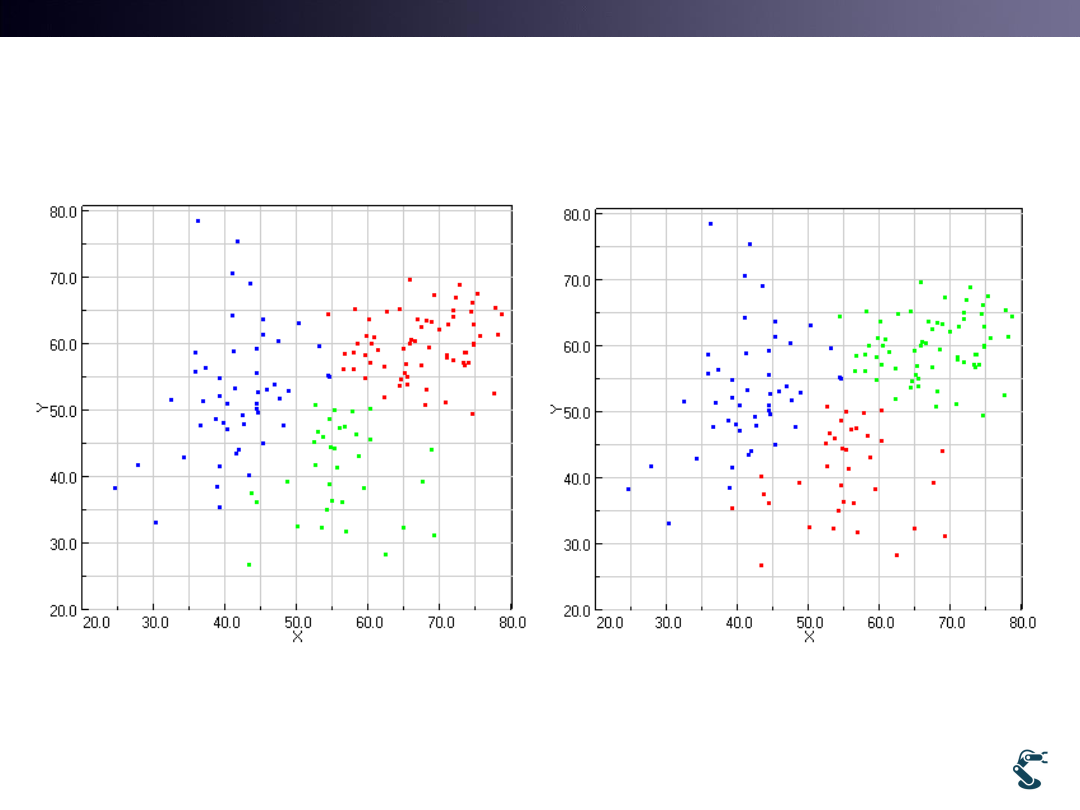
Wrong Number of Groups
29
kmean.test3(50,50,70,70,60,30,20)
kmean.test3(40,80,70,30,50,50,20)
• Thus, what is the Answer? No answer in General.
T&C LAB-AI
Expectation Maximization
3
30
T&C LAB-AI
Robotics
Introduction to
Expectation Maximization
• Let’s think EM in a simple way.
• We have random variable, X
• Maybe, X has two groups.
• How we separate X with
two groups, probabilistically?
31
T&C LAB-AI
Robotics
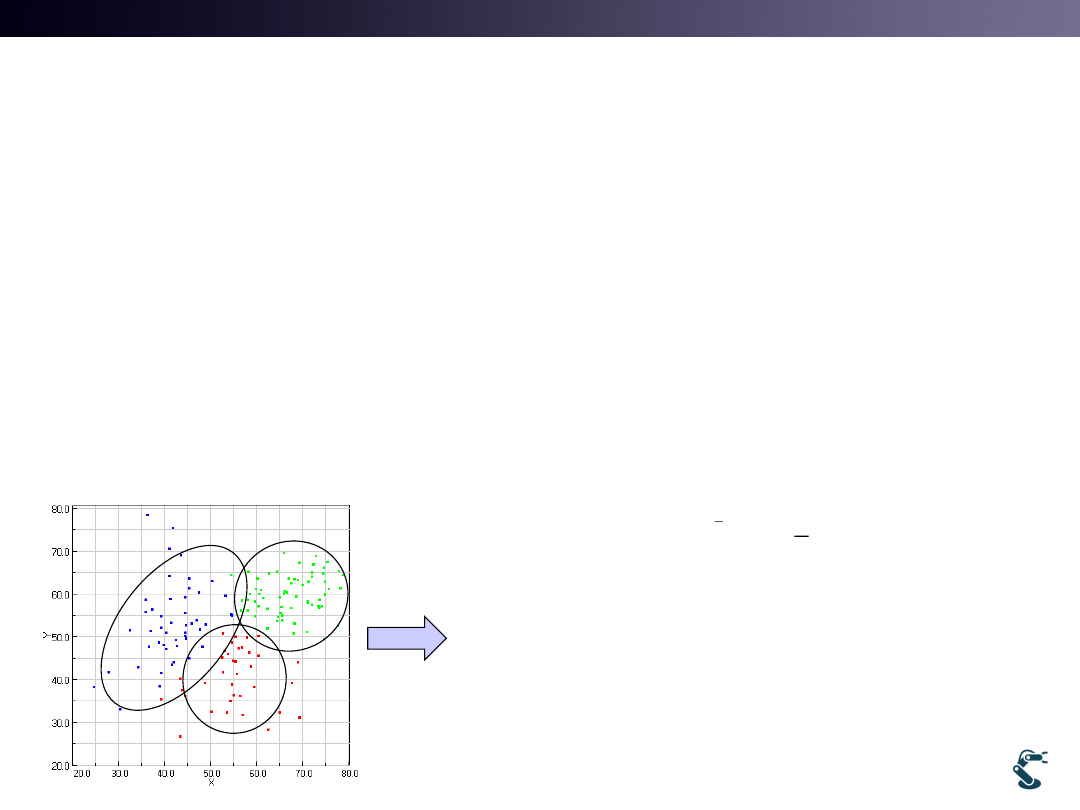
EM has two Steps
• Clusters are represented by Probability Distribution
– K-means Clustering is a set of data around centroids.
– But, clusters in EM are the Probabilistic Distribution
• Assumption:
– Data are the Mixture of Gaussian Distributions
– Blue, Red, and Green points are mixed with Gaussian distribution
32
1
1
2
1
ˆ
g( )
(2 )
( )
exp
2
T
d
x
Det
x
x
Re
Re
(
|
), ( ˆ
|
), (
|
ˆ
ˆ
ˆ
)
,
}
ˆ
ˆ
ˆ {
,
Gre
Blue
Red
Green
d
en
Gr
Blue
een
Blue
d
x
x
p
C
p
C
p
C
x
x
x
x
x
T&C LAB-AI
Robotics
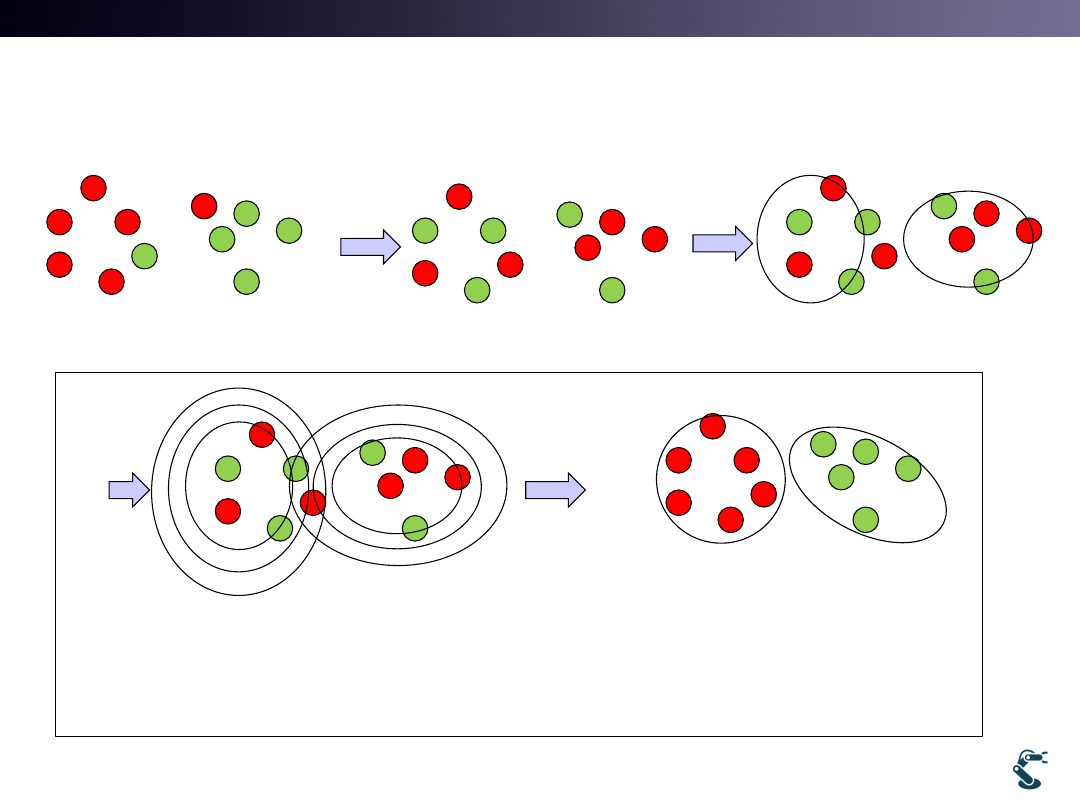
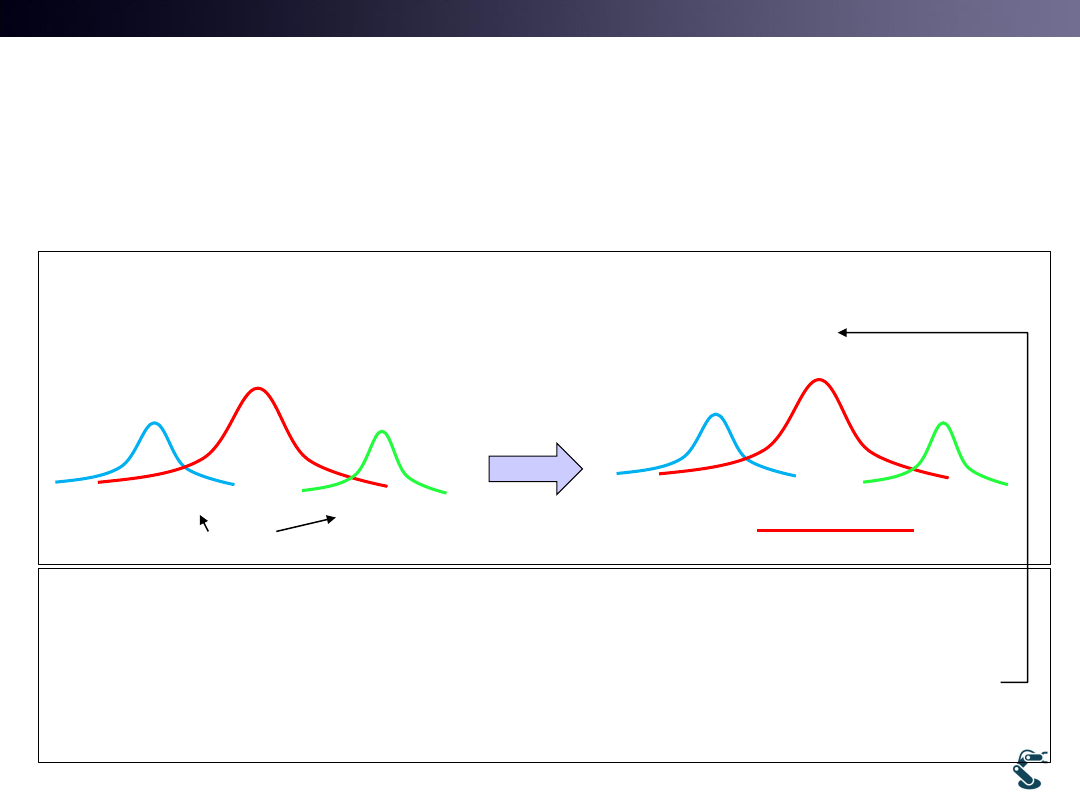
Simple EM Procedure
33
We get labeled data
Mix Randomly
Initial guess of PDF
Compare PDF and
rearrange class
Recalculate PDF
Expectation
Maximization
Repeat E-M
T&C LAB-AI
Robotics
Probabilistic Density Function has
mean and variance
• 0. Data is given
• 1. Guess groups
• 2. maximum PDF is wrong in some data
• 3. Find mean and variance for each group
34
4
5
7
8
6
1
2
9
3
ˆ ˆ
ˆ
ˆ ˆ ˆ
,
ˆ
,
,
ˆ ˆ ˆ
,
, }
,
{
,
, x x x x x
x x x
x
x
1
2
3
4
5
6
7
8
9
ˆ
ˆ ˆ ˆ ˆ ˆ ˆ ˆ ˆ ˆ
{ ,
,
,
,
,
,
,
, }
x
x x x x x x x x x
8
3
4
5
1
2
2
6
7
9
1
3
ˆ
(
)
ˆ
mean(
)
ˆ
mean( ˆ
ˆ ˆ ˆ ˆ ˆ
,
,
,
ˆ ,
ˆ
,
,
)
ˆ
x x
x
mean
x
x
x
x x
x
3
4
5
6
1
2
7
1
2
8
3
9
ˆ ˆ ˆ ˆ ˆ
,
,
ˆ
ˆ ˆ
,
(
)
(
ˆ
,
)
,
(
)
,
s
std
s
st
x x x x
x
x x
x
x
d
s
std
3
4
5
6
7
9
1
8
2
ˆ ˆ ˆ
ˆ ˆ
,
,
ˆ ˆ ˆ ˆ
,
,
}
,
,
ˆ {
,
,
x x x x x
x
x
x
x
x
Fix
4
5
7
8
6
1
2
9
3
ˆ ˆ
ˆ
ˆ ˆ ˆ
,
ˆ
,
,
ˆ ˆ ˆ
,
, }
,
{
,
, x x x x x
x x x
x
x
Red?
Expectation
Maximization

T&C LAB-AI
Robotics
Expectation and Maximization
Step 1. Expectation
• Density function, p(x|c) for each cluster, C
• Density function, P(x) for clustering model,
– W is the fraction of the Cluster C in the entire data
• Assign points to Clusters
35
1
1
2
1
ˆ
p( | )
(2 )
( )
exp
2
T
d
x C
Det
x
x
0
1
{
,
,...,
}
k
M
C C
C
4
5
7
8
6
1
2
9
3
ˆ ˆ
ˆ
ˆ ˆ ˆ
,
ˆ
,
,
ˆ ˆ ˆ
,
, }
,
{
,
, x x x x x
x x x
x
x
Re
1
3
Blue
d
Green
W
W
W
( |
)
( |
)
(C | )
( )
( |
)
i
i
i
i
i
k
i
i
i
p x C
W p x C
P
x
W
P x
W p x C
( )
( |
)
k
i
i
i
P x
W p x C

T&C LAB-AI
Robotics
Expectation and Maximization
Step 2: Maximization
• Recompute Model
36
1
(
| )
i
i
x
W
P C x
n
0
1
' {
,
,...,
}
k
M
C C
C
(
| )
(
| )
i
x
i
i
x
xP C x
P C x
2
(
)
(
| )
(
| )
i
i
x
i
i
x
x
P C x
P C x
T&C LAB-AI
Robotics
EM in 1 Dim.
• Assume that there are 2 groups
• Guess x with Blue and Red groups
37
Blue ~
(1,1), Red ~
(3,1)
N
N
T&C LAB-AI
Robotics
• Use same initial guess
• It is very Robust
38
1
2
1
2
1
2
ˆ
ˆ
3,
5
1
0.5
W
W

T&C LAB-AI
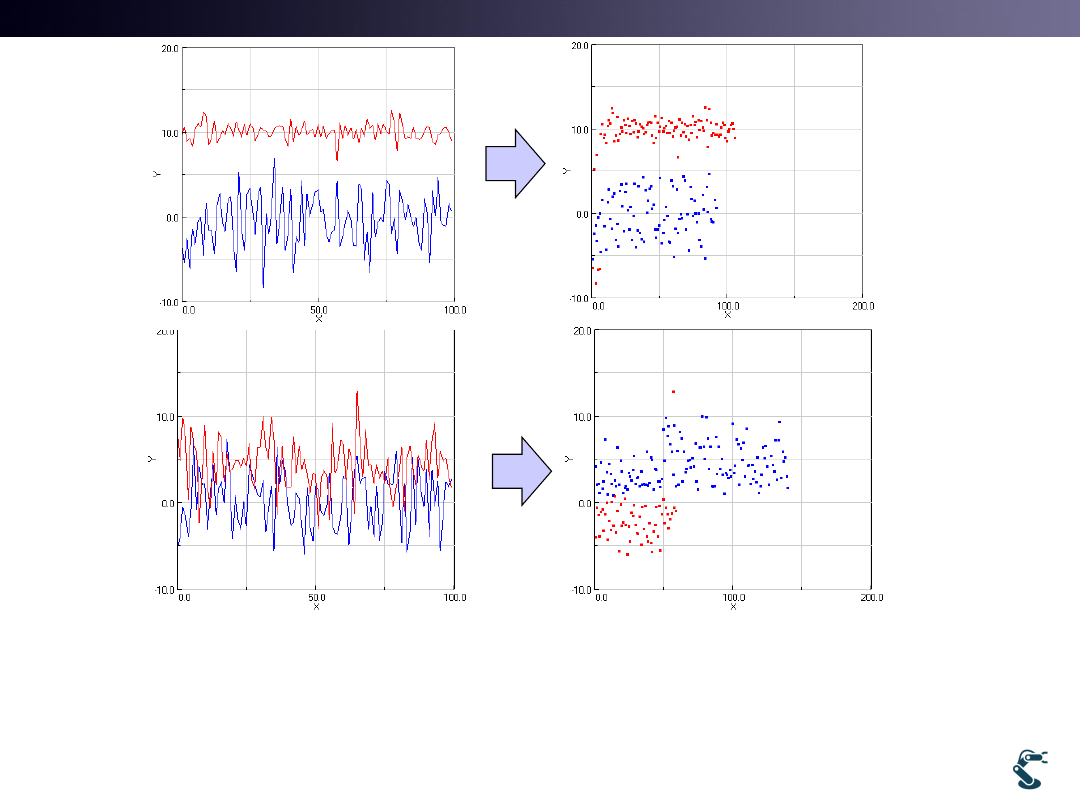
Robotics
But, EM is designed Carefully
• EM looks simple.
• E-M or M-E shows very different result
• 1. Expectation with given parameters
– Initial Guess of mean, variance, and fraction factor, W are first
used.
– At the first step, Do not calculate mean, variance, and so on
• 2. Maximization with p(c|x), and not with p(x|c)
– E and M looks similar. It causes confusion
• 3. If M(calculate parameters) works first, EM often fails.
39
T&C LAB-AI
Robotics
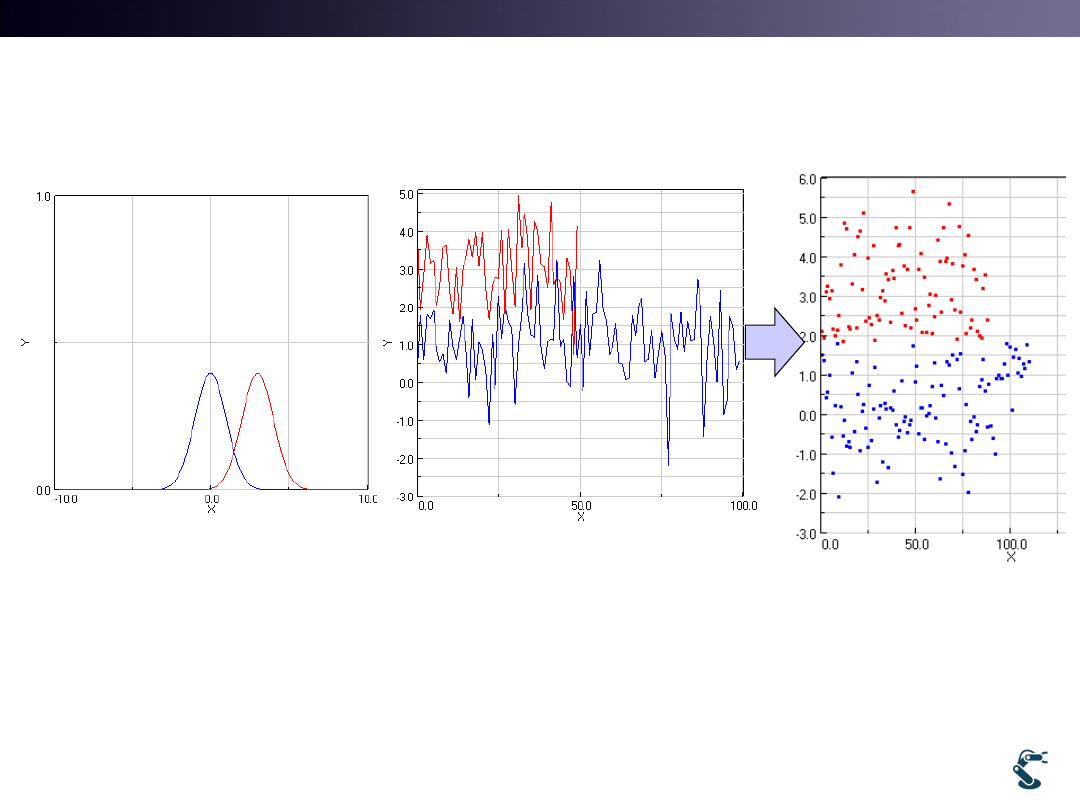
Example) ex/ml/l12em1.py
Generate Blue and Red
40
2
Blue ~
(0,3 ), Red ~
(10,1)
N
N
T&C LAB-AI
Robotics
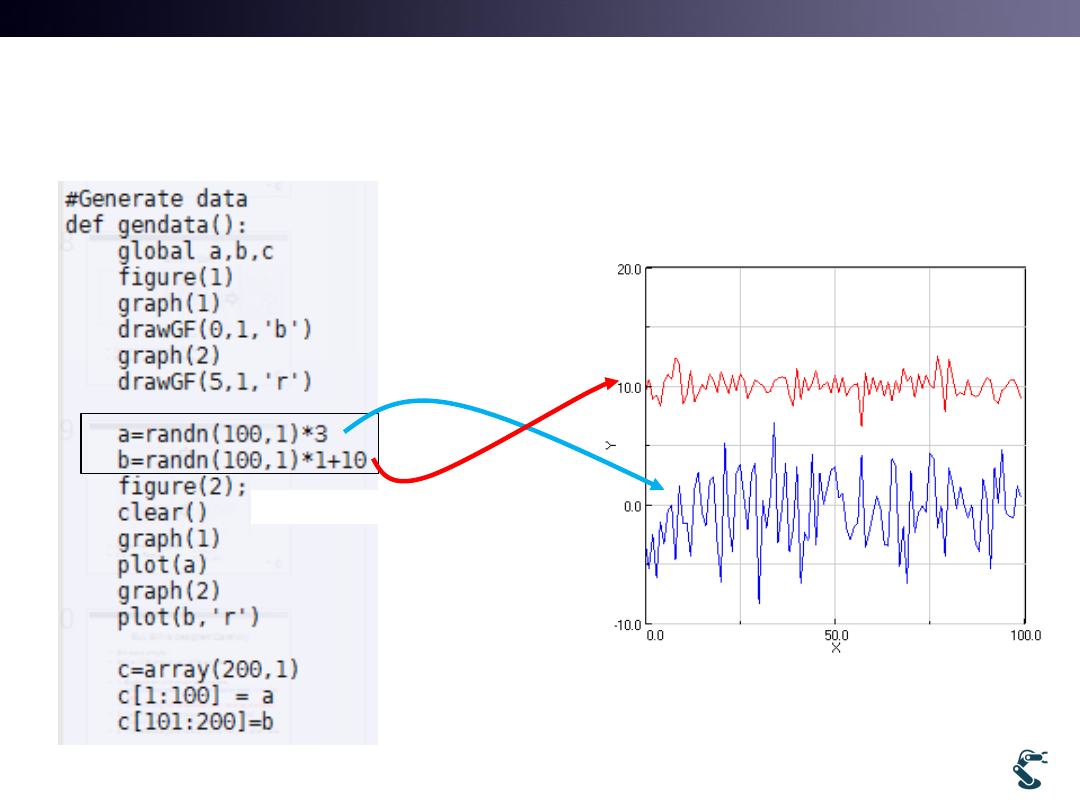
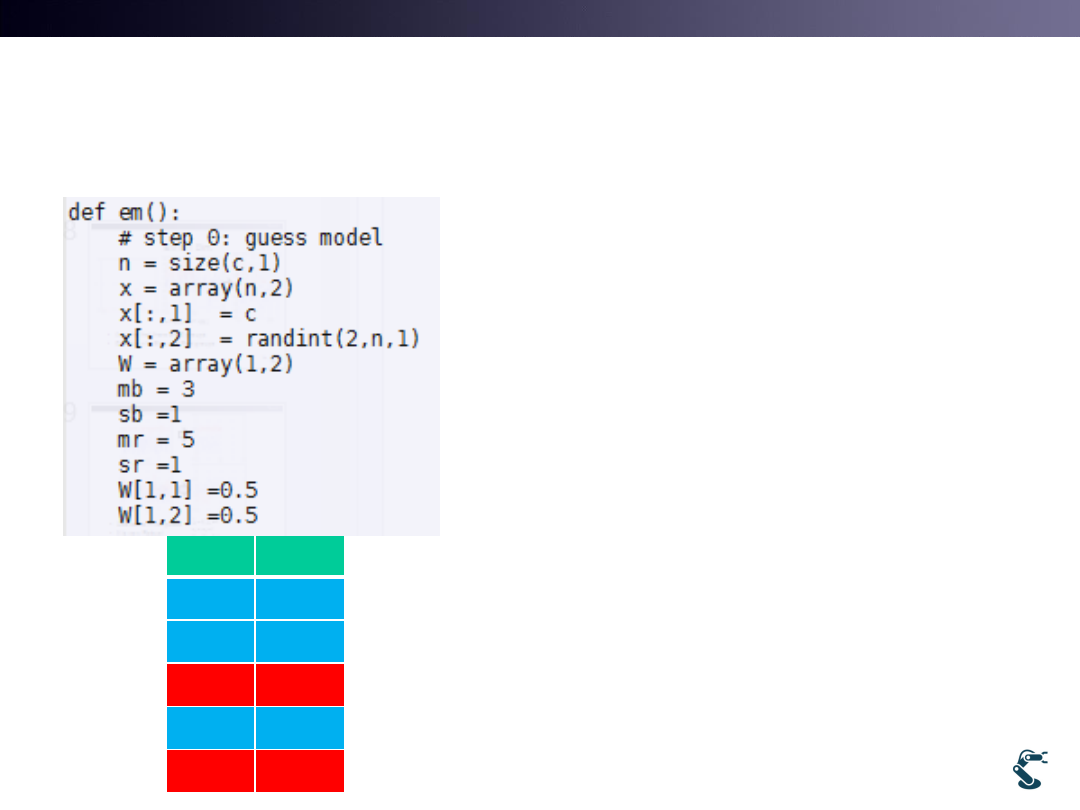
Example) ex/ml/l12em1.py
Initial Guess
point label
0.2
0
1.3
0
10.1
1
3.3
0
11.5
1
41
• Matrix X has two column
– 1st column is random data
– 2nd column, label 0 is blue and
label 1 is red
• Mb=mean of blue
• Sb= standard deviation of blue
• Mr = mean of red
• Sr =standard deviation of red
• W[1,1] = W1
• W[1,2] = W2
T&C LAB-AI
Robotics
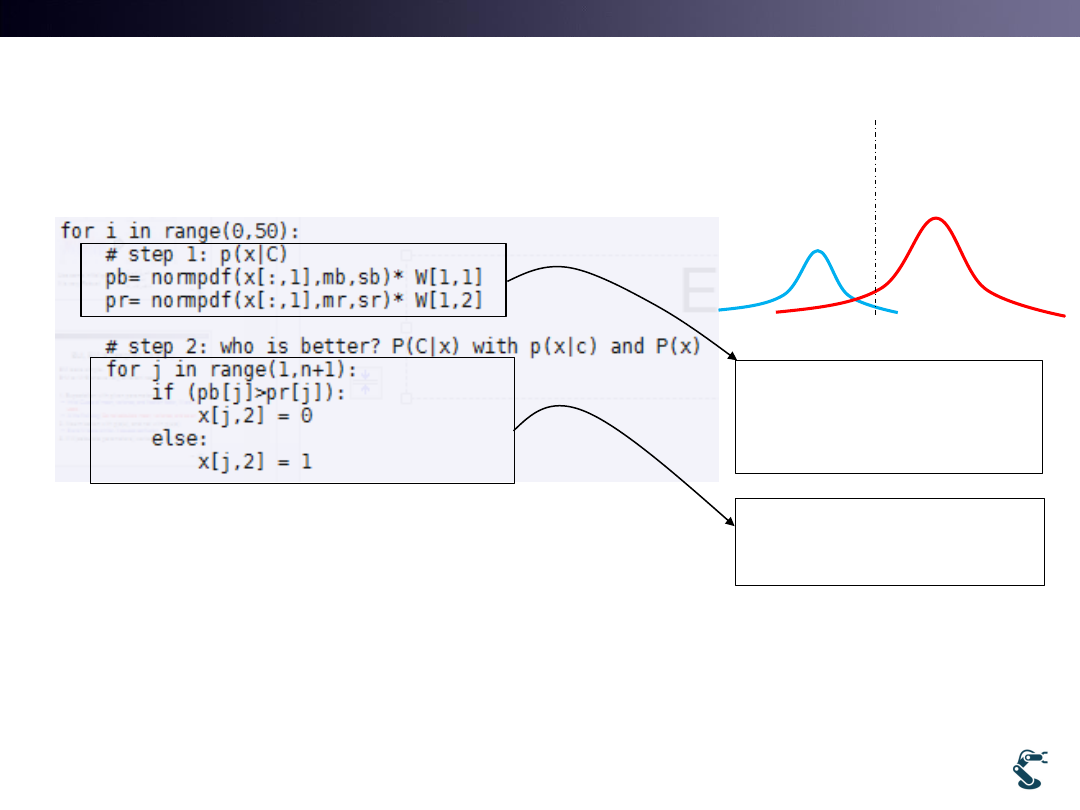
Example) ex/ml/l12em1.py
Expectation
• P(x|C) is the p.d.f. of x with respect to a Cluster
• P(C|x) means a new Cluster, C is determined by
p(x) comparison
42
1
2
3
4
5
6
ˆ ˆ ˆ
,
,
, ˆ ˆ
ˆ {
}
ˆ
,
,
x x
x
x
x
x
x
1. This PDF is given by the
previous(or initial)
Parameters.
2. Blue p(x3) < Red p(x3)
Change x3’s label is 1(red)
T&C LAB-AI
Robotics
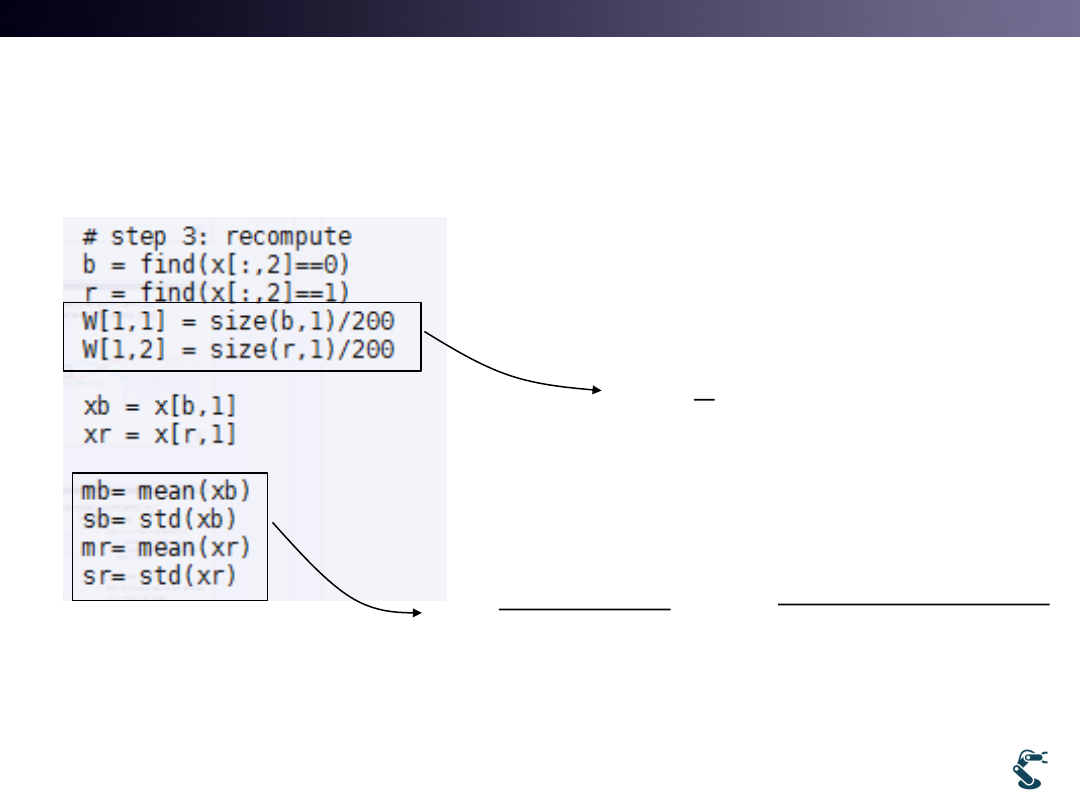
Example) ex/ml/l12em1.py
Maximization
• With a new Model, M’
• Recompute Wi
• New Mean and variance
43
0
1
' { ' , ' ,..., ' }
k
M
C
C
C
1
(
| )
i
i
x
W
P C x
n
(
| )
(
| )
i
x
i
i
x
xP C x
P C x
2
(
)
(
| )
(
| )
i
i
x
i
i
x
x
P C x
P C x

T&C LAB-AI
Robotics
EM in 2Dim
• Above two points are regarded as Blue one in the
right picture.
– Because, EM is based on a probabilistic distribution.
44
-5
0
5
10
15
-4
-2
0
2
4
6
8
10
x
y
true value
-5
0
5
10
15
-4
-2
0
2
4
6
8
10
x
y
data clustered by EM
True Case
EM Result
See these
points
T&C LAB-AI
Robotics
Why We Learn EM and GMM?
Imitation Learning is Not Doing Memorized Motion
45
• 1990’s: Encoder Recording and Replay
• After 2005: Trajectories are considered as the set of
Stochastic Process
T&C LAB-AI
Gaussian Mixture Model
4
46
T&C LAB-AI
Robotics
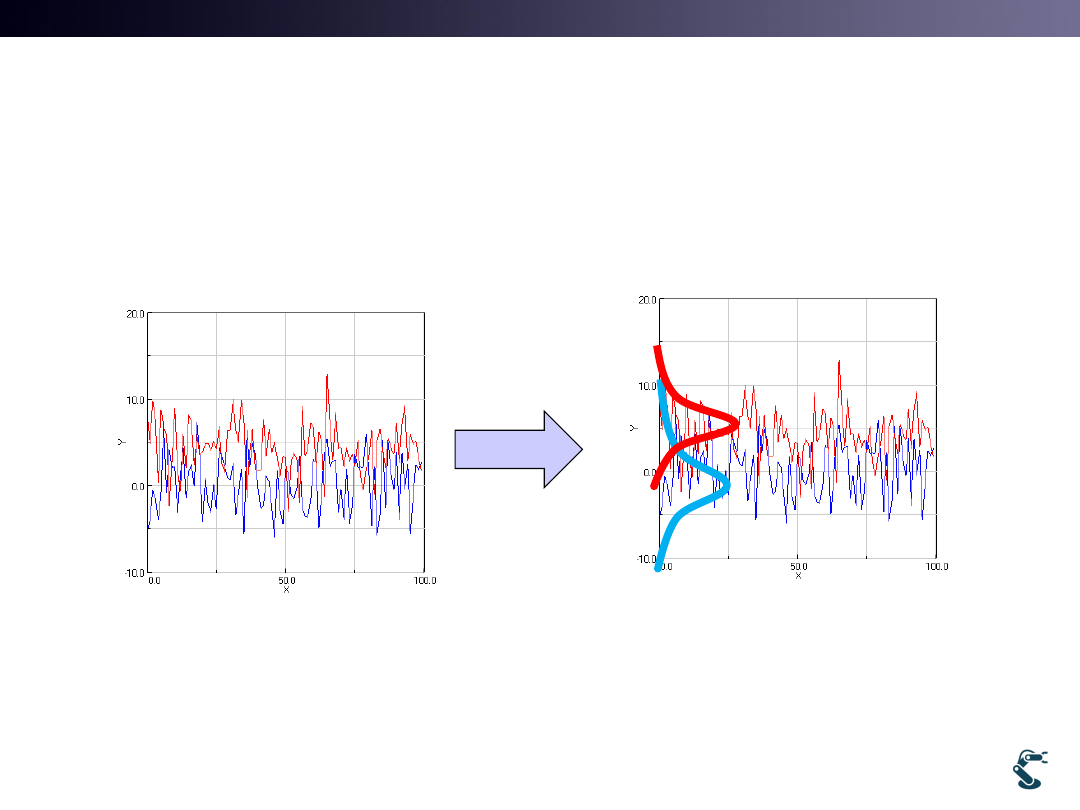
Gaussian Mixture Model
• Extend k-means Clustering into a Probabilistic framework
as like EM method
• Left signal is the mixture of Two Different Gaussian
– Goal of GMM is to find Multiple Gaussian Distributions
47

T&C LAB-AI
Robotics
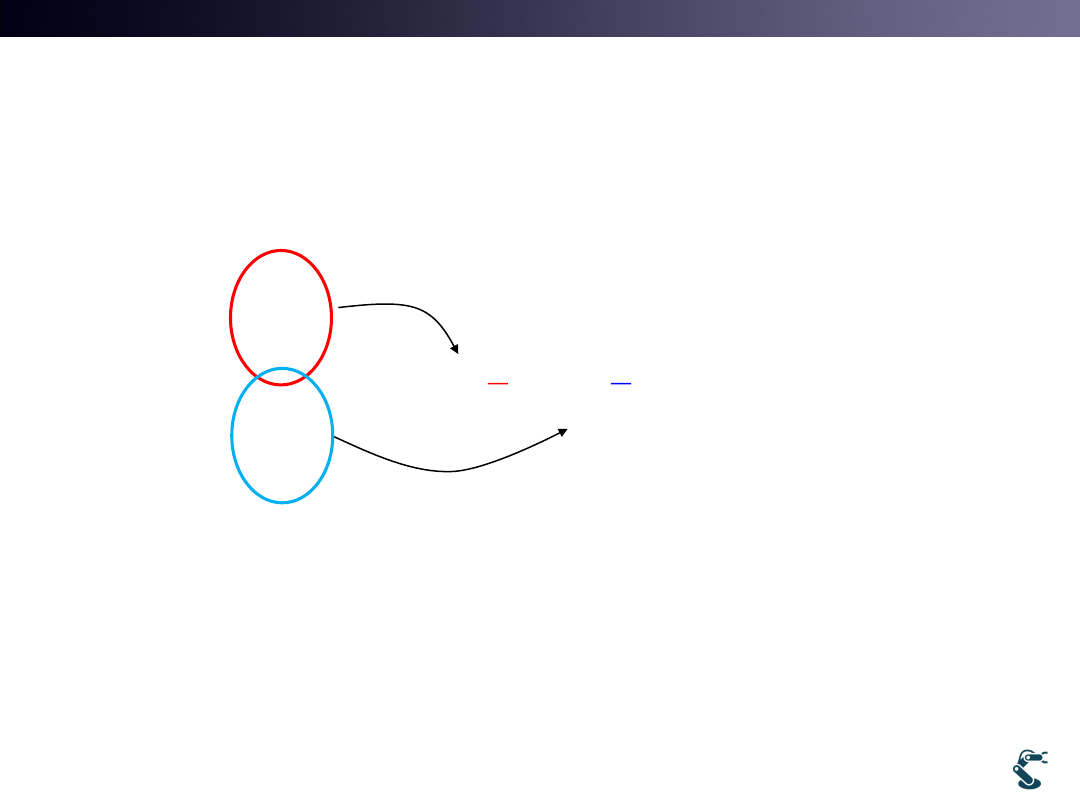
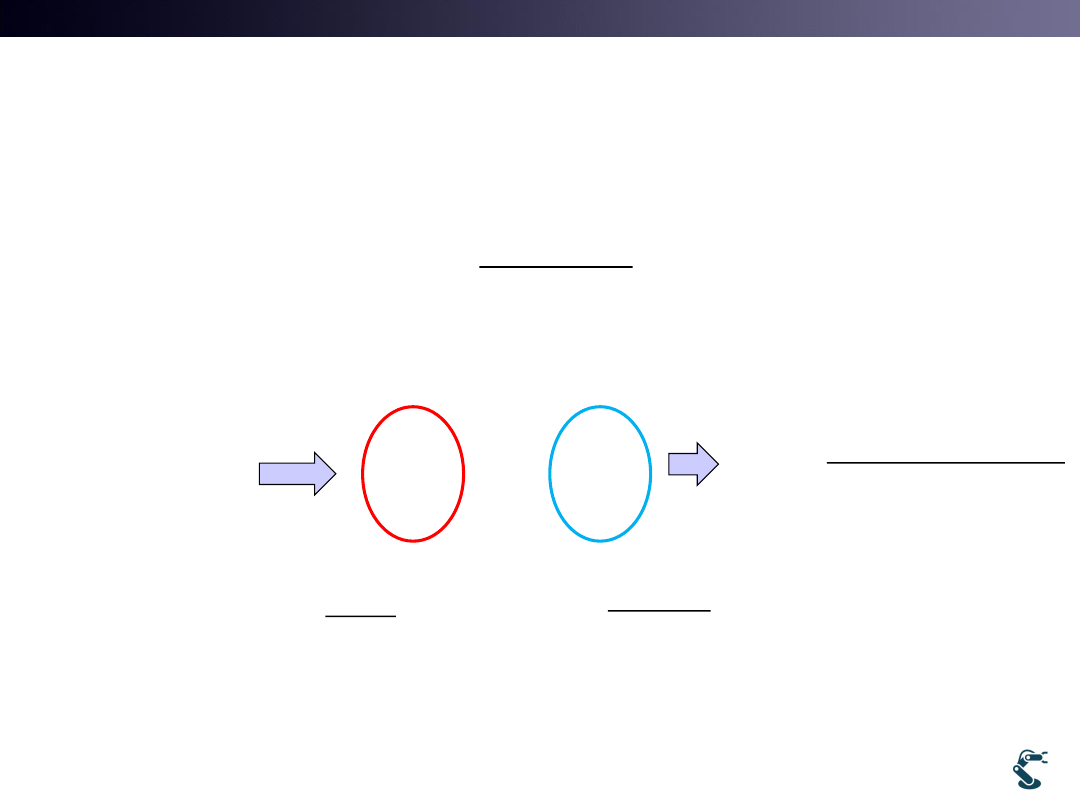
Modeling of GMM
• Assume that the j th point of the vector x belongs to
the i th Cluster.
• Gaussian PDF of the i th cluster is defined as,
48
( )
( ,
,
)
: the input vector
: the mean value of the th cluster
: the covariance(variance) of the th cluster
i
i
i
i
i
G x
f x
x
i
i
1
1
2
1
(2 )
( )
exp
2
T
N Det
x
x
( )
( |
,
)
i
i
i
i
p x
p x
1
i
i
T&C LAB-AI
Robotics
Example
i for Cluster and j for input, x
49
1
1.1
10
10.1
x
1
i
2
i
1
2
,
1
2
1
2
i
i
1
2
3
4
1
1.1
10
10.1
j
j
j
j
x
x
x
x
•
is the prior probability.
Pr(
)
i
i
x C
T&C LAB-AI
Robotics
Probability of
the jth point belongs to the ith cluster
50
1
( )
( )
j
i
i
i
k
k
k
G x
W
G x
1
1.1
10
10.1
x
1, 1.1
10, 10.1
1
1
1
1
1 1.1
2
( )
( ,
,
)
G x
f x
2
2
2
2
10 10.1
2
( )
( ,
,
)
G x
f x
1
1
1
1
1
2
2
( )
( )
( )
j
j
j
j
G x
W
G x
G x

T&C LAB-AI
Robotics
51
1
( )
( )
j
i
i
i
k
k
k
G x
W
G x
Expectation Procedure:
Probability of
the jth point belongs to the ith cluster
1
1
1
1
2
2
( )
( )
( )
j
j
i
j
j
G x
W
G x
G x
1
1.1
10
10.1
x
1
1
1
1
1
1
1
1
2
2
1
2
1
1
2
1
1
1
2
2
2
2
3
1
1
1
1
1
2
2
4
1
1
1
1
1
2
2
(
1)
(
1)
(
1)
(
1.1)
(
1.1)
(
1.1)
(10)
(10)
(10)
(10.1)
(10.1)
(10.1)
j
j
j
j
G x
W
G x
G x
G x
W
G x
G x
G
W
G
G
G
W
G
G
1
2
2
1
2
1
1
1
2
2
1
2
2
2
2
2
1
1
2
2
2
2
3
2
2
2
1
1
2
2
4
2
2
2
1
1
2
2
(
1)
(
1)
(
1)
(
1.1)
(
1.1)
(
1.1)
(10)
(10)
(10)
(10.1)
(10.1)
(10.1)
j
j
j
j
G x
W
G x
G x
G x
W
G x
G x
G
W
G
G
G
W
G
G

T&C LAB-AI
Robotics
Maximization
• What is the objective function?
• Log likelihood
52
( )
( ;
,
)
i
i
i
i
i
p x
p x
,
i
i
i
Best
for Cluster
( , , )
log
( ; , , )
log ( ; , , )
log (
| w ; , ) (w ; )
j
j
j
j
j
j
j
j
L
p x
p x
p x
p
( )
,
|
j
j
j
j
j
i
i
i
i
i
i
p x
p x w
p x
w
p w

T&C LAB-AI
Robotics
Maximization of Log likelihood
53
1
2
1
1
1
1
1
{ ,
,...,
}
1
(
)(
)
,
N T
N
j
i
i
j
N
N
j
j
j
j
j
T
i
i
i
i
j
j
i
i
N
N
j
j
i
i
j
j
x
x x
x
W
N
W x
W
x
x
W
W
T&C LAB-AI
Robotics
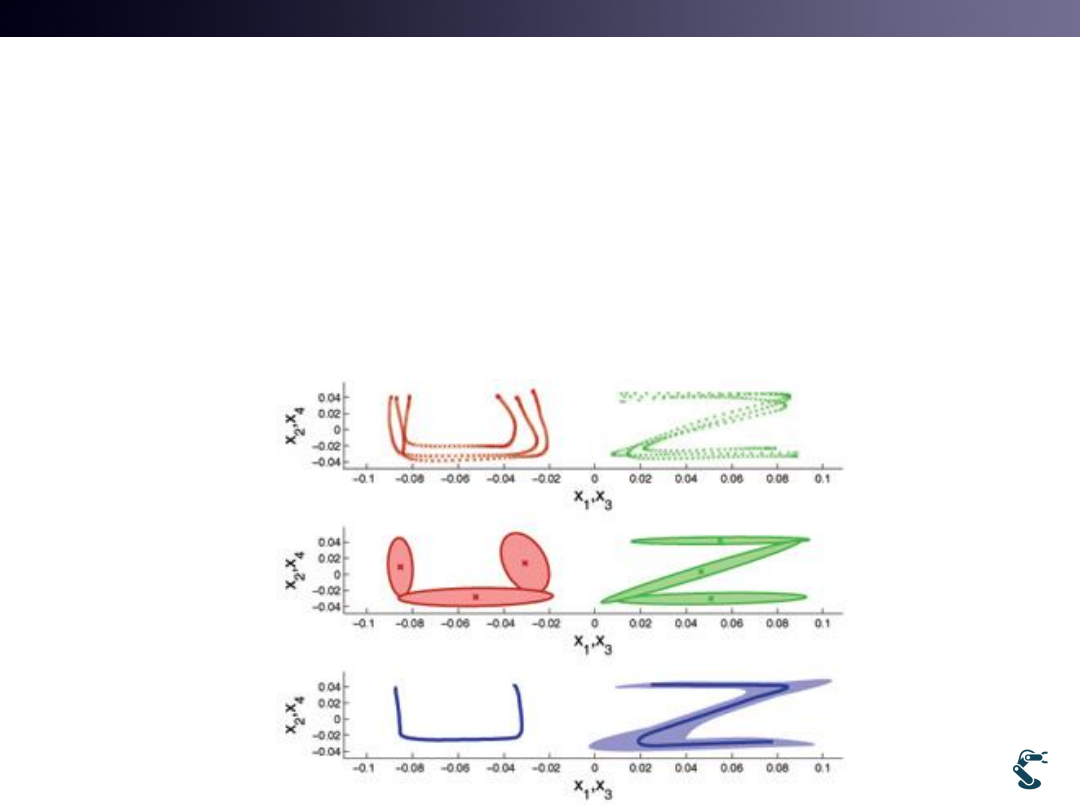
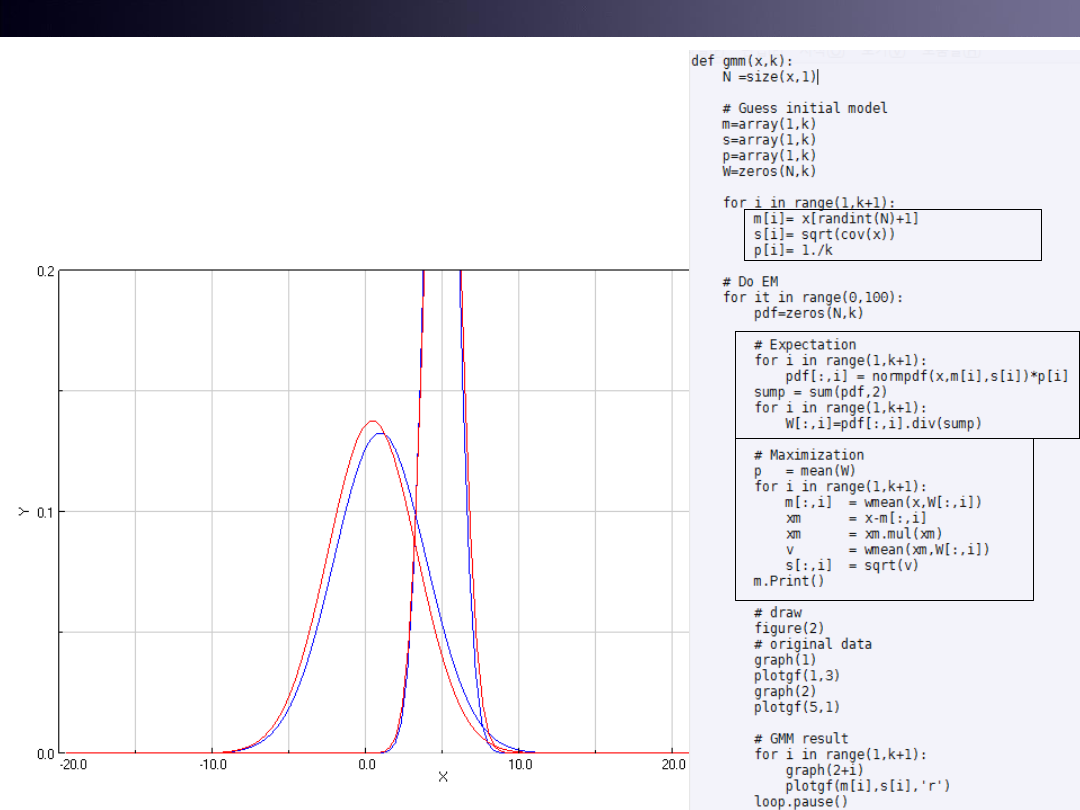
Example of gmm1
• Edit ex/ml/gmm1
54
Blue: Data
Red : GMM

T&C LAB-AI
Robotics
Ref:
Maximum Likelihood Estimation(MLE)
• Estimating parameters of a probability distribution
– by maximizing a likelihood function
55
( ;
)
(
| )
( ,
| )
:
L
X
p X
p X Z
dZ
Z unobserved or latent data
